This is the second of two posts I’ve published with some notes and takeaways from two amazing days at the KubeCon Europe 2017 (the first post is focused on Kubernetes).
These notes have been primarely taken for myself, thus they could be incomplete, inexact, or no more true at the time you will read it, so don’t give anything written here as the absolute source of truth. If you notice any wrong information, please comment below and I will fix it asap.
That said, enjoy reading!
CNCF
Prometheus is one of the projects supported by the Cloud Native Computing Foundation(CNCF), a no-profit organization founded in late 2015. Thanks CNCF, for supporting it!
High Availability Prometheus
There are two distinct components you’ve to setup in HA, in order to have an high availability monitoring system based on Prometheus:
- Prometheus
- AlertManager
HA Prometheus
To setup Prometheus in HA, you just have to run two identically configured Prometheus servers in parallel. They will be completely independent each other, they will both scrape the same metrics, they will both store data on their own local storage and they will fire alerts independently.
In case one of the two Prometheus servers will die (or a network partition will occur) the whole set of metrics will be continued to be scraped from the other Prometheus server.
This is one of the cases where a pull-based model comes very handy. You don’t have to re-configure your clients adding the endpoint of a secondary monitoring server (like you will do in case of a push-based system). The secondary Prometheus server will run through your service discovery and will scrape metrics in the same exact way the first Prometheus server does.
To be fair, “primary” and “secondary” is not the right naming, since there’s no hierarchy in this HA setup, and both servers will act independently. But I guess you got the point, right?
HA AlertManager
To setup the AlertManager in HA, is a bit more complicated. You could run two identically configured AlertManager servers, each one getting alerts from one of the two Prometheus servers, but then you will get double alerts and it’s definitely not what you wanna get. Luckly something better has been done.
HA AlertManager has been introduced in version 0.5 and it’s based on Weave Mesh, a coordination layer based on the well known Gossip protocol.
The setup requires you to run 2+ instances of the AlertManager and 2+ Prometheus servers configured to send alerts to all the alert managers. AlertManagers are then configured to communicate with each other (via Weave Mesh) in order to coordinate who will actually dispatch the alerts to receivers. The system has been designed to guarantee an alert will be sent as least once.
Please be aware HA AlertManager is still under active development. For more information about how to setup HA Alert, please see the doc.
Resources:
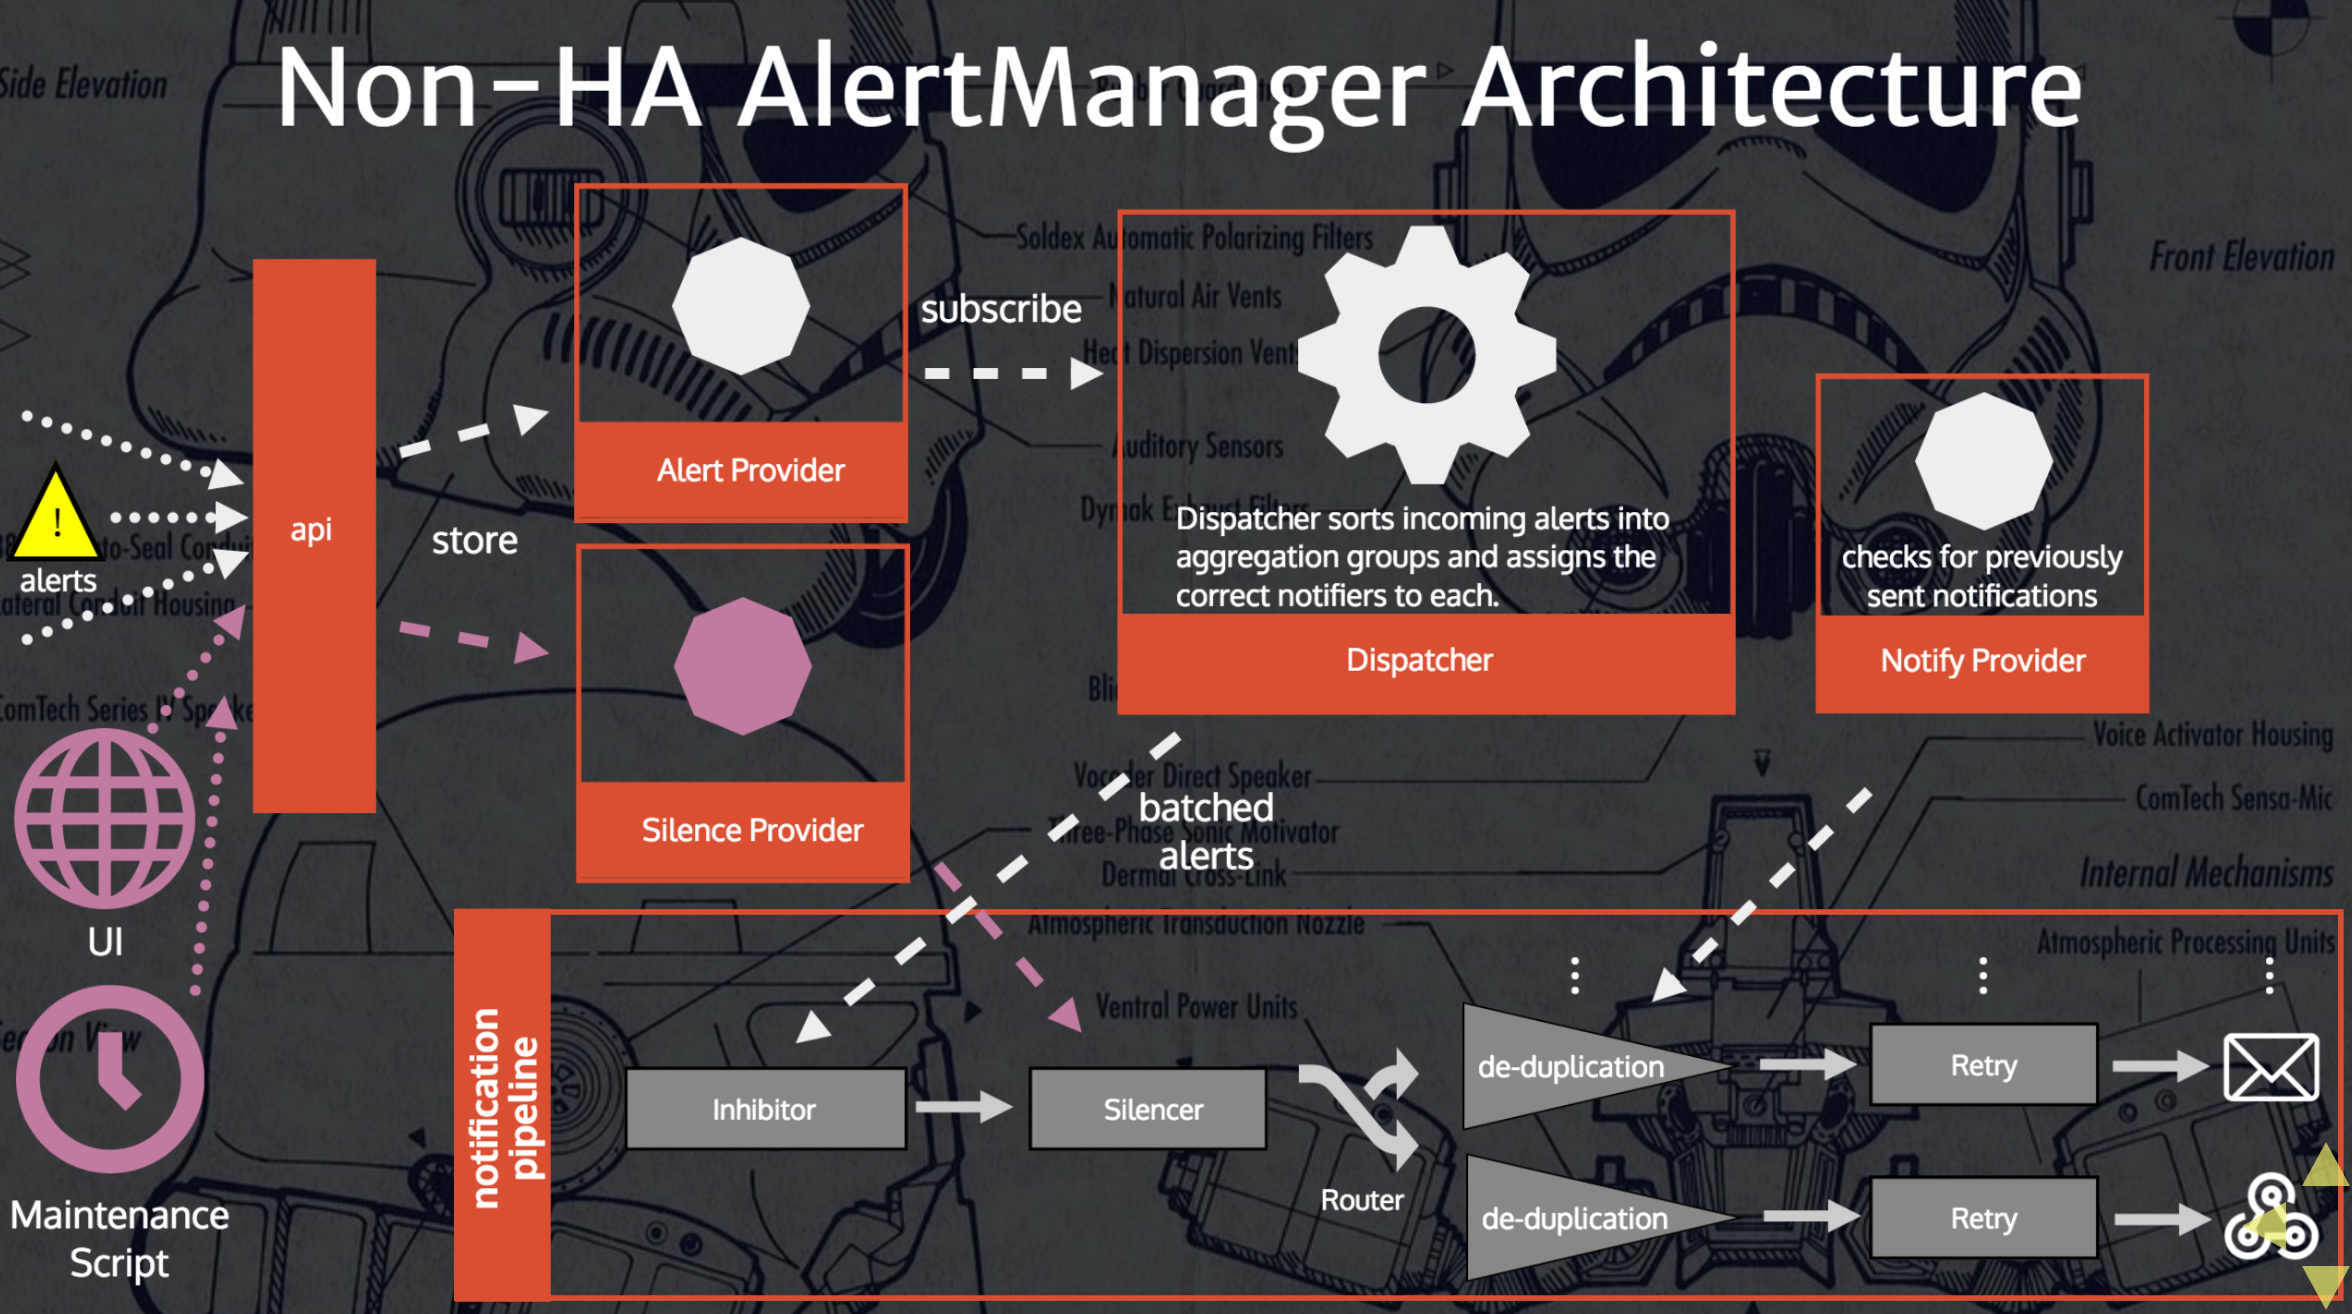
- NON HA-architecture (slide)
- HA setup (slide)
- HA AlertManager setup documentation
A bad practice I’ve learned about
At Spreaker we don’t have a Prometheus HA setup yet (we recently started using Prometheus, and we’re gradually migrating the metrics to it). However, I’ve just realized a very bad practice we have adopted to export few of our metrics.
To keep it simple, we’ve a specific custom exporter that - for performance reasons - instead of returning counters, it returns gauges whose values represent just the difference between the current state and the previous value fetched from Prometheus.
This is a very bad practice for at least a couple of good reasons:
- If a scraped metric is not successfully stored on Prometheus (ie. networking issue during the request) it will be lost forever, while it doesn’t if you use monotonic counters since it will be included in the next scraping
- In HA setup you will have two distinct Prometheus servers fetching the same metric, and it will definitely not work
Thanks to the KubeCon talks for making me realizing it. I will fix it as soon as I come back to office!
Prometheus Remote Storage
Prometheus was designed to store metrics on a local storage. It uses LevelDB to store indexes and a custom storage layer to store sample data, organized in chunks of 1024 bytes.
The local storage had several benefits, including keeping the system simple and being able to deliver the monitoring system we do use and love today. It obvisouly has some limitations:
- Not durable
- Not long-term
- Not scalable
The idea of a remote storage is definitely not new (issue #10) and Prometheus has a legacy write support to OpenTSDB, InfluxDB and Graphite. However, the plan is to replace it with a generic interface.
After a long internal discussion, Prometheus came up with the following design:
- Write path: send samples to the remote storage (instead of sending chunks). Do minimal queueing and retries (to avoid consuming too much memory). The protocol is HTTP+protobuffer for now (in order to support HTTP/2). Only samples scraped at the moment are pushed to the remote storage (no built-in mechanism to migrate data, pushing already-scraped data).
- Read path: centralized PromQL evaluation. It means PromQL will be evaluated on the Prometheus server and not on the remote storage (it simplifies the logic on the remote storage).
- Rules and Metadata API will support only local data.
There’re currently two remote storages available:
- Chronix (write-only)
- WeaveCortex (read+write)
WeaveCortex:
- Horizontally scalable Prometheus
- As a service or self-hosted (OSS)
- Stores data on AWS
High Performance Prometheus
Configuring Prometheus for High Performance is not an easy topic, because Prometheus does an extensive usage of memory and it’s basically about optimizing it. The following is what I understood from the great talk by Björn Rabenstein (slides).
Concepts
Prometheus scrapes sample data from metrics endpoints, and chunks this data together in chunks of constant size (1024 bytes). Each chunk is a bulk of sample data for a specific series. These chunks are then stored on disk in one file per series.
Prometheus keeps all the currently used (incomplete) chunks in memory. In addition, it keeps the most recently used chunks in memory up to a configurable threshold.
Prometheus tries to batch up write operations to store chunks on disk in order to reduce the disk pressure, so completed chunks are not stored immediately to disk but delayed and batched together. This leads to an higher memory pressure, since completed chunks will be kept in memory until written to disk.
Optimizing memory (Prometheus 1.5.2)
The goal is to optimize the memory usage and not occur into an OOM. Since you’ve to balance memory usage and disk pressure, your goal should be configuring Prometheus to use almost all the memory available without incuring into an OOM.
If you set too much conservative memory limits, you will not efficiently utilize your available RAM and you will be slowed down by the disk, but if you set too much high memory limits you could easily incur into an OOM and loose chunks not yet persisted to disk. You’re basically asked to wear your wizard hat.
To be fair, it’s worth to note that Prometheus uses checkpoints to store incomplete chunks to disk and reduce the impact of a crash. The default
storage.local.checkpoint-interval is 5 minutes. Checkpoints are out of the scope of this recap.
To know all the configuration options available type:
prometheus -h
Options to optimize memory:
storage.local.memory-chunks: how many chunks can Prometheus keep in memory. Remember, it’s the number of chunks, not the size in bytes. Suggested value:/ 1024 / 6 storage.local.max-chunks-to-persist: how many chunks can be waiting to be written to the disk. Suggested value:memory-chunks / 2.
It’s also suggested to set the GO Garbage Collector threshold to 40%, exporting the environment variable
export GOGC=40 before starting Prometheus (this is not required in Prometheus 1.6, since it will be the default).
There are many more options to tune the memory usage and local storage. Please read the documentation and the slides for a better overview.
There’s also a great blog post by Brian Brazil explaining Prometheus memory usage and tuning in detail: How much RAM does my Prometheus need for ingestion?
The rushed mode
Now things get interesting. When the number of chunks in memory, waiting to be persisted to disk, grows too much, Prometheus enters the rushed mode and speed up persisting chunks.
Prometheus calculate an urgency score, as the number of chunks waiting for persistence in relation to
max-chunks-to-persist and on how much the number of chunks in memory exceeds the memory-chunks.
The urgency score is a value between 0 and 1. When the value is > 0.8, Prometheus enters the rushed mode. In rushed mode, Prometheus does the following:
- Write operations to persist chunks on disk are not throttled anymore and performed as fast as possible.
- Optimization: series files are not synced after write operations anymore, speeding up the disk operations at the cost of an increased risk of data loss in case of a server crash.
- Optimization: checkpoints are created less frequently, freeing more disk bandwidth for persisting chunks, at the cost of an increased risk of data loss in case of a Prometheus crash.
Prometheus leaves rushed mode once the score is < 0.7.
Monitoring Prometheus memory
Prometheus exports metrics itself, including information about the local storage. It’s suggested to monitor the local storage and the memory usage, ensuring Prometheus never goes OOM.
You would also want to monitor
prometheus_local_storage_persistence_urgency_score. As described before, you’re in trouble when the urgency score is > 0.8 and continue to grow for some time. It means that Prometheus entered the rushed mode (which is still OK), but can’t persist chunks to disk quickly enough to exit the rushed mode in a short time.Prometheus 1.6 (to be released, soon)
Prometheus 1.6 will introduce a new flag
storage.local.target-heap-size that should simplify the memory configuration. With this flag you will tell Prometheus how much memory it can use.
Prometheus 1.6 will also set
GOGC=40 by default.Prometheus 2.0 (to be released, late 2017)
Prometheus 2.0 should solve most of the memory issues. He will wear the wizard hat for you :)
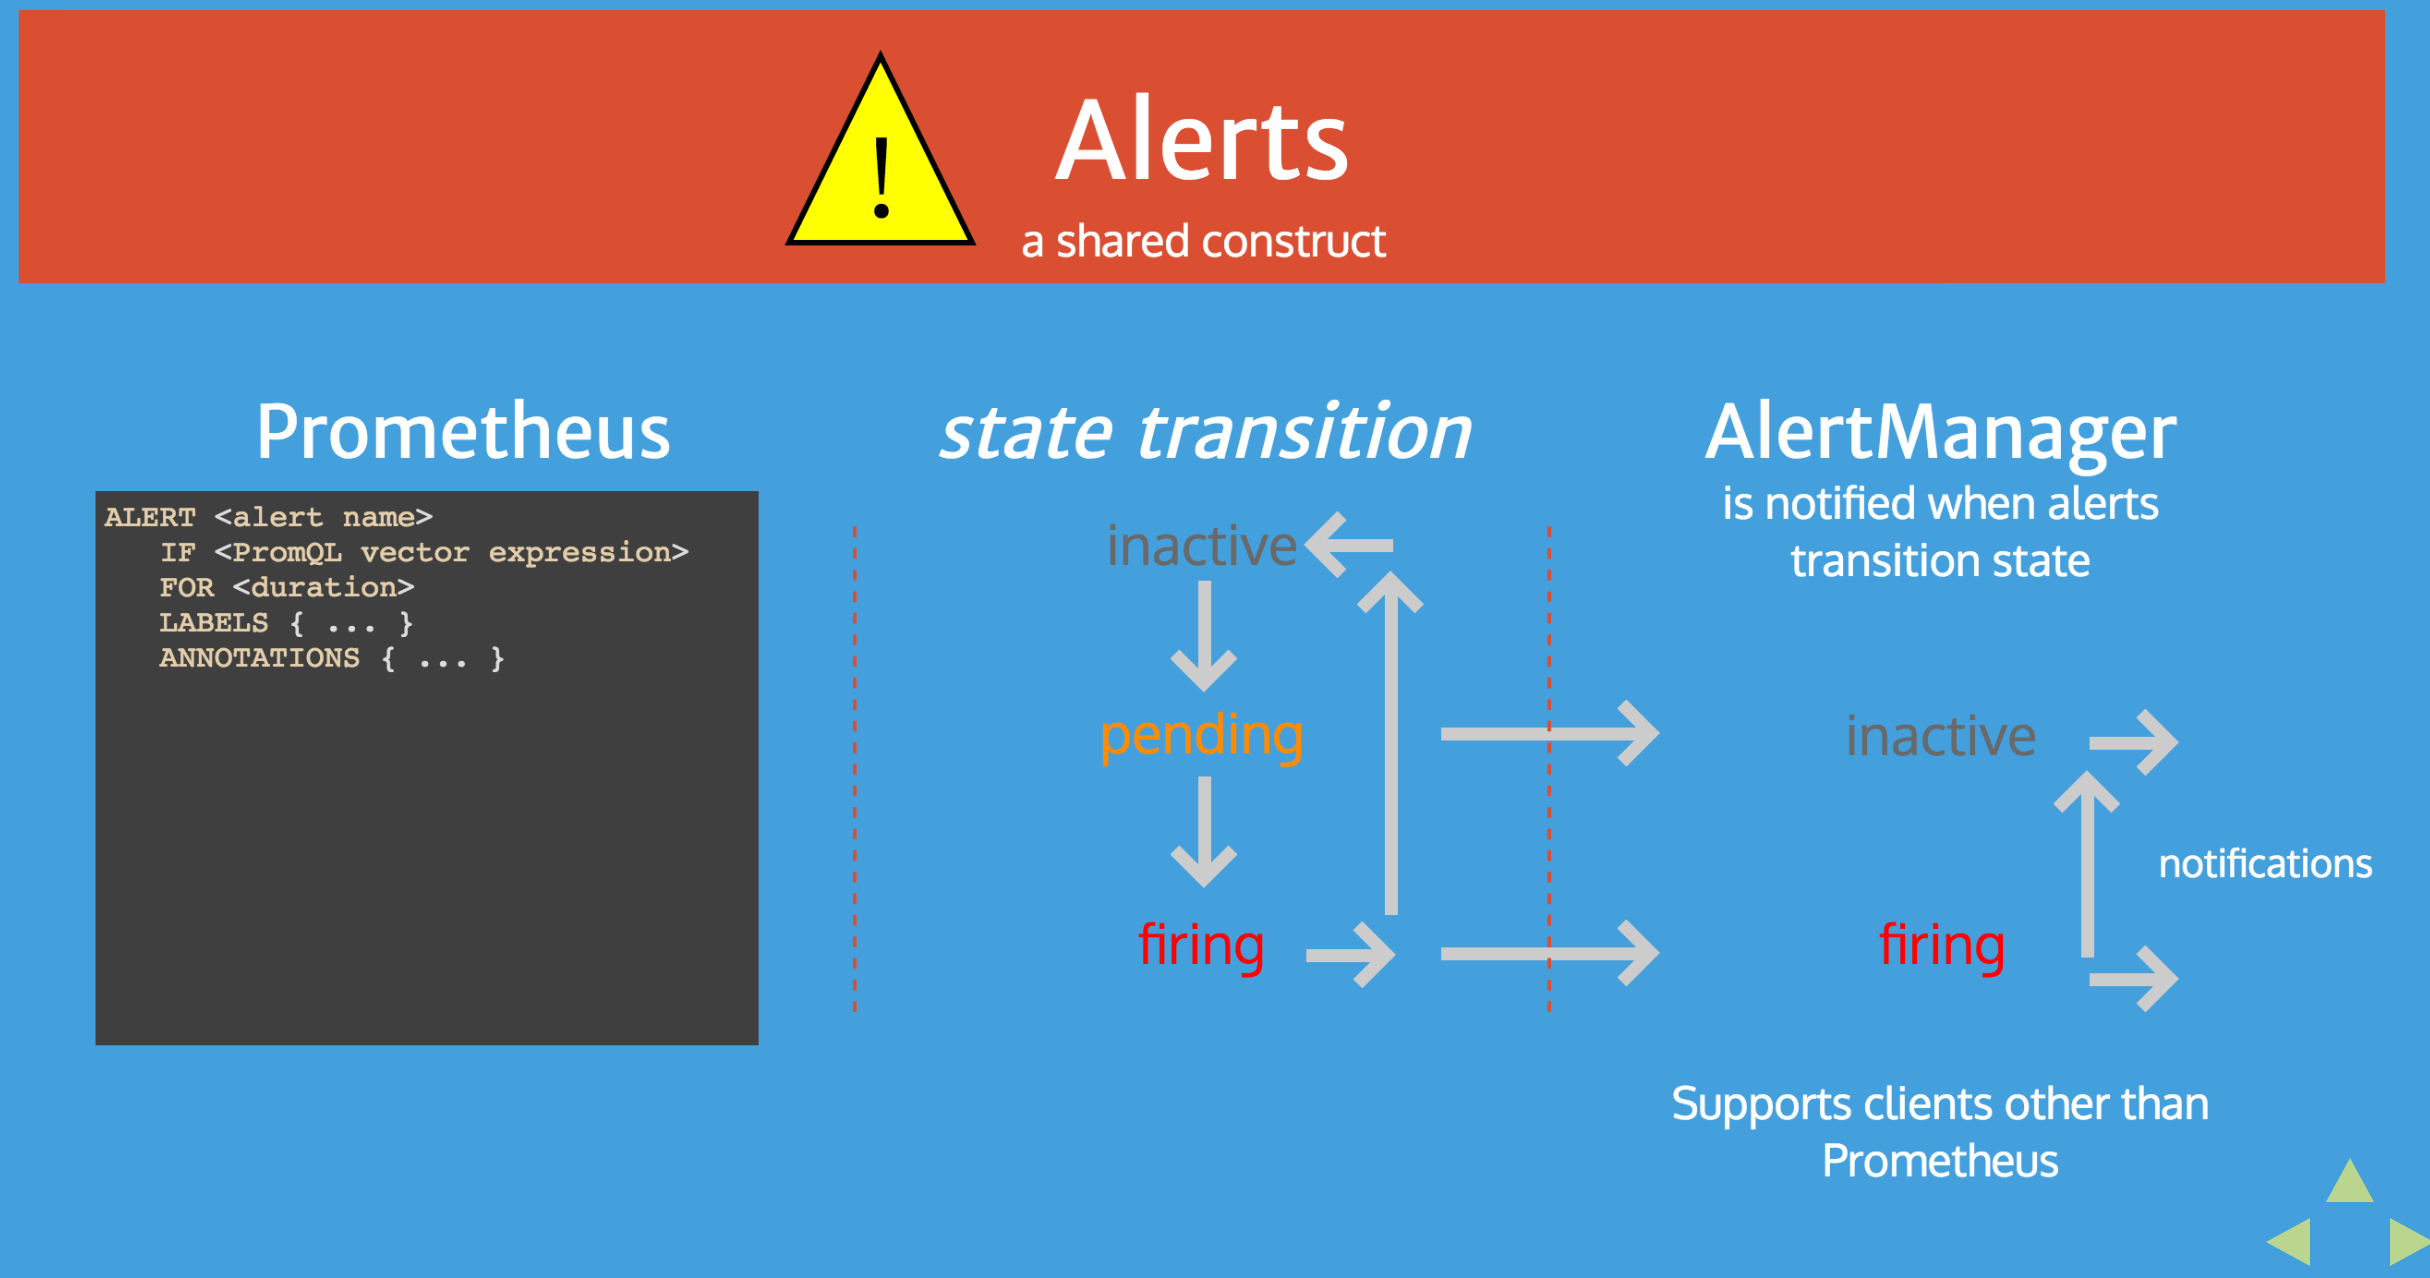
AlertManager Architecture
I’ve found pretty clear a couple of slides from the talk Understanding and Extending Prometheus AlertManager.
I’ve also covered a bit the alert states into my old post “Prometheus: understanding the delays on alerting”, but let me report such slides here as further integration.
Counting with Prometheus
Counting, in a monitoring system, is not that easy as it could sound. If you’ve ever used Prometheus in production I’m pretty sure you’ve already realized it and how it works.
Brian Brazil gave a very good in-depth talk about Prometheus counters, and how they differ from other monitoring systems. If you’re new to the topic, I suggest you to check out his presentation (slides are quite self-explanatory):
Few things worth to note:
increase()is only syntactic sugar overrate()rate()extrapolation: if the begin/end data points are within the 110% of the requested time range, Prometheus does extrapolation over the full time range, otherwise it does the extrapolation of the 50% of the missing time window both on the begin and end of the range (see the slides for more details)
Best practices:
- Use gauge only for metrics for which you just wanna check the last value. Use counters for everything else.
- Use seconds for timing. All Prometheus values are 64-bit float, so you can represent any timing in the second unit with a great precision.
increase()is handy for display, but userate()in alerting rules.- The
query_rangeHTTP endpoint has a step parameter. Use it, to reduce the returned data points.
Monitoring Kubernetes
A couple of resources I wasn’t aware of:
kube-state-metricsis a simple service that listens to the Kubernetes API server and export metrics about the state of the cluster (deployments, nodes and pods).kube-prometheusis a collection of documentation, manifests, dashboards and alerting rules to ease end-to-end Kubernetes cluster monitoring.
Q&A with some people at the conf
Q: Is running Prometheus and the AlertManager on Kubernetes a good practice?
A: It is, as far as it’s in a HA setup and until you don’t hit performance issues.
A: It is, as far as it’s in a HA setup and until you don’t hit performance issues.
Comments
Post a Comment
https://gengwg.blogspot.com/