Overview
Nodes are a vital component of a Kubernetes cluster and are responsible for running the pods. Depending on your cluster setup, a node can be a physical or a virtual machine. A cluster typically has one or multiple nodes, which are managed by the control plane.
Because nodes do the heavy lifting of managing the workload, you want to make sure all your nodes are running correctly. The kubectl get nodes command can be used to check the state of your nodes.
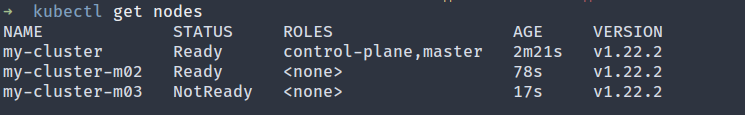
A node with a NotReady status means it can’t be used to run a pod because of an underlying issue. It’s essentially used to debug a node in the NotReady state so that it doesn’t lie unused.
In this article, you’ll learn a few possible reasons why a node might enter the NotReady state and how you can debug it.
The NotReady State
As mentioned earlier, each node in a cluster is used to run pods. Before a pod is scheduled on a node, Kubernetes checks whether the node is capable of running the pod or not. The STATUS column in the output of kubectl get nodes represents the status. The possible values in this column are:
- Ready: The node is healthy and ready to accept pods.
- NotReady: The node has encountered some issue and a pod cannot be scheduled on it.
- SchedulingDisabled: The node is marked as unschedulable. This can be done using the kubectl cordon command.
- Unknown: The node is unreachable by the control plane.
Having a node in the NotReady state means that the node is effectively unused and will accumulate costs without participating in running pods. Furthermore, losing a node can negatively impact your production workload.
In order for your application to run smoothly, you must debug them quickly.
Possible Causes of the NotReady State
There can be various reasons why a node might enter the NotReady state. This section will review some of the most common reasons for this error.
Scarcity of Resources
To operate normally, a node must have sufficient disk space, memory, and sufficient processing ability. If a node is running low on disk space or the available memory is low, it will go into the NotReady state. If pressure exists on the processes, eg too many processes are running on the node, it will also change to the NotReady state.
Network Misconfiguration
If the network has not been correctly configured on the node or it can’t reach the internet, the node will be unable to communicate with the master node and will be listed as NotReady.
Issue with kubelet Process
kubelet is an agent that runs on each node. It is responsible for communicating with the Kubernetes API server and registering the nodes. If kubelet crashes or stops on the node, it will not be able to communicate with the API Server and will be in the NotReady state.
Issue with kube-proxy
kube-proxy is a network proxy that runs on each node and maintains the network rules. These rules allow network communication to your pods from inside or outside your cluster. If kube-proxy crashes or stops, the node will be in the NotReady state.
Vendor Specific Issues
Suppose you’re using a cloud-hosted solution like GKE or EKS. In that case, some vendor-specific issues may be preventing your nodes from operating normally and communicating with the control plane. These issues could be IAM misconfiguration, misconfigured network rules, etc.
Debugging the NotReady State
As you can see, the NotReady status can be caused by a multitude of issues. This section will help you identify the root cause of the problem. However, it’s essential to understand that how you go about fixing these issues depends on the exact cause and your cluster setup. There are no one-size-fits-all solutions. But, once you identify the root cause, it should be easier to resolve it.
Check the kube-proxy Pod
First, ensure that each node has exactly one kube-proxy pod and is in the Running state.
The output might look like this:
If any one pod is in some state other than Running, use the following command to get more information:
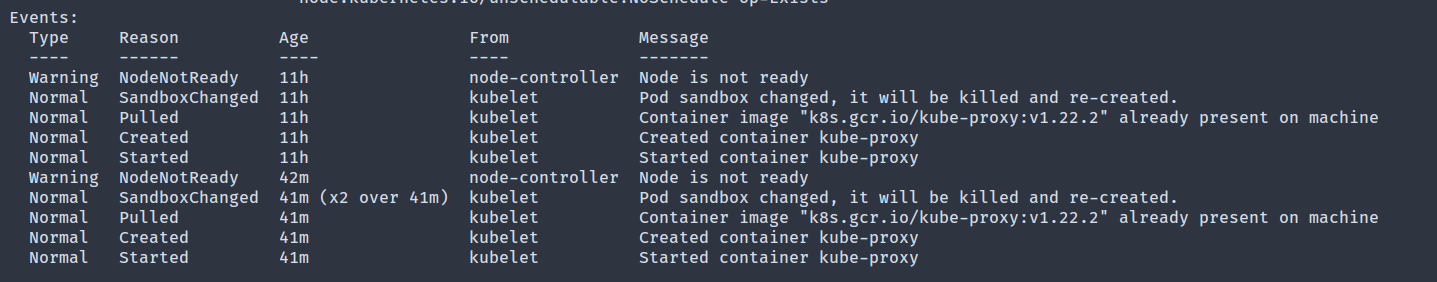
The Events section logs the various events on the pod, and it could be an excellent place to start looking for any mishaps.
You can get access to the pod logs by running the following command:
The logs and the events list is a good place to start looking for any issues.
If your node does not have a kube-proxy pod, then you need to inspect the kube-proxy daemonset, which is responsible for running one kube-proxy pod on each node.
The output of this command might reveal any possible issue with the daemonset.
Verify Resources are Available
Run the following command to get detailed information about a node that is not ready:
In the output, the Conditions section shows if the node is running out of resources or not.

The following conditions are available:
- MemoryPressure: If True, it indicates that the node is running out of memory.
- DiskPressure: A True value in this field indicates that the node lacks enough space.
- PIDPressure: If too many processes are running on the node, this field will be True.
- NetworkUnavailable: If the network for the node is not correctly configured, this will be True.
- Ready: If the node is healthy and ready to accept pods, this will be True. In this field, a False is equivalent to the NotReady status in the get nodes output. It can also have the Unknown value, which means the node controller has not heard from the node in the last node-monitor-grace-period (defaults to 40 seconds).
If any one of the first four conditions is True, you have identified the problem.
Verify kubelet is Running
If all the Conditions fields show Unknown, it might hint that the kubelet process on the node has run into some issues.

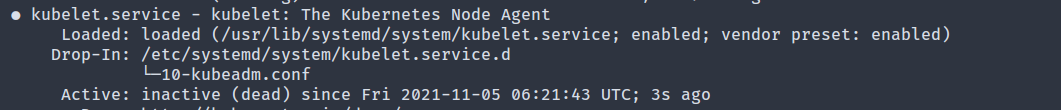
To debug this, first SSH into the node and check the status of the kubelet process. If it’s running as a systemd service, use the following command:
If the Active field shows inactive (dead), it means the kubelet process has stopped.
To reveal the possible reason for the crash, check the logs with the following command:
Once the issue is fixed, restart kubelet with:
Verify Network Communication with the Control Plane
If the Conditions field shows NetworkUnavailable, it indicates an issue in the network communication between the node and the control plane.
A few possible fixes:
- If the node is configured to use a proxy, verify that the proxy allows access to the API server endpoints.
- Ensure that the route tables are appropriately configured to avoid blocking communication with the API server.
- If you’re using a cloud provider like AWS, verify that no VPC network rules block communication between the control plane and the node.
You can run the following command from within the node to verify that it can reach the API server.
If the output shows succeeded, then network communication is working correctly.
Vendor Specific Debugging
If you’re using a cloud provider like EKS, or GKE, sometimes it’s worth looking into vendor-specific issues if you’ve exhausted all other debugging techniques. EKS has an extremely detailed guide that you can follow.
GKE provides an auto repair feature that can attempt to repair a node that has been in the NotReady state for a given amount of time. If all else fails, you can always get in touch with your cloud provider for more assistance.
Comments
Post a Comment
https://gengwg.blogspot.com/