Prometheus is an open source monitoring system that allows you to collect metrics from any configured target system. Prometheus implements a multi-dimensional data-model with powerful queries, great visualization, precise alerting, and comes with many integrations.
Prometheus originally was created by SoundCloud in 2012, but has now become an independent open source project maintained independently by the open source community - all components are available under the Apache 2 License on Github.
In this tutorial, I will show you how to install and configure Prometheus and the node_exporter. We will install Prometheus monitoring system and then configure the node_exporter to collect metrics from the server. We will be using the CentOS 7 server for this tutorial guide.
Prerequisites
- CentOS 7 server
- Root privileges
What will we do?
- Create a new user and download Prometheus
- Configure Prometheus As a Systemd Service
- Configure Firewalld
- Install and Configure node_exporter
- Add node_exporter to the Prometheus Server
- Testing
Step 1 - Create a new User and Download Prometheus
In this tutorial, the Prometheus service will run as a non-root user. So we need to create a new non-root user on the system. We will create a new user named 'prometheus', and all prometheus services will be running under the prometheus user.
Create new 'prometheus' user using the command below.
useradd -m -s /bin/bash prometheus
A new user has been created. Now log in to the user and download prometheus using the wget command.
su - prometheus
wget https://github.com/prometheus/prometheus/releases/download/v2.2.1/prometheus-2.2.1.linux-amd64.tar.gz
Extract the prometheus-xx.x.x.tar.gz file and rename the directory to 'prometheus'.
tar -xzvf prometheus-2.2.1.linux-amd64.tar.gz
mv prometheus-2.2.1.linux-amd64/ prometheus/
Prometheus is downloaded to the server, and all prometheus files are on the '/home/prometheus/prometheus' directory.
Step 2 - Configure Prometheus As a Systemd Service
In this step, we will configure prometheus as a systemd service. We will create a new service file prometheus.service on the '/etc/systemd/system' directory.
Go to the '/etc/systemd/system/' directory and create new service file 'prometheus.service' using vim editor.
cd /etc/systemd/system/
vim prometheus.service
Paste the prometheus service configuration below.
[Unit]
Description=Prometheus Server
Documentation=https://prometheus.io/docs/introduction/overview/
After=network-online.target

[Service]
User=prometheus
Restart=on-failure

#Change this line if you download the
#Prometheus on different path user
ExecStart=/home/prometheus/prometheus/prometheus \
  --config.file=/home/prometheus/prometheus/prometheus.yml \
  --storage.tsdb.path=/home/prometheus/prometheus/data

[Install]
WantedBy=multi-user.target
Save and exit.
Now reload the systemd system using the systemctl command below.
systemctl daemon-reload
Start the prometheus service and enable it to launch everytime at system startup.
systemctl start prometheus
systemctl enable prometheus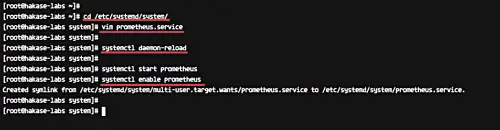
The prometheus is now running as a systemd service, check it using the command below.
systemctl status prometheus
Make sure you get the 'Running' service status.
Or check it using the netstat command below.
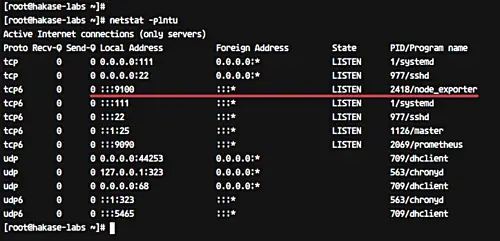
netstat -plntu
Make sure you get the result as shown below.
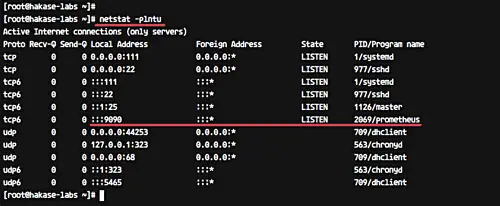
Prometheus is running by default under the port '9090'.
Step 3 - Configure Firewalld
If you're using Firewalld on your system, add the port 9090 to the Firewalld list ports.
Open port 9090 for the Prometheus access using firewall-cmd commands below.
firewall-cmd --add-port=9090/tcp --permanent
firewall-cmd --reload
Now open your web browser and type the server IP address with port 9090.
http://192.168.33.10:9090/graph
Type 'http_requests_total' in the query field and click the 'Execute' button.
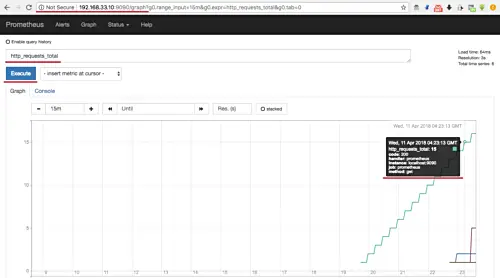
And you will see HTTP requests to the prometheus server with all info about the time, HTTP status code, and method etc.
Step 4 - Install and Configure node_exporter
node_exporter is an exporter of machine metrics that can run on *Nix and Linux system.
In this tutorial, we will install the node_exporter on the same server prometheus. We will monitor and get the metric of the prometheus server.
Login to the prometheus user and download the 'node_exporter' using the wget command.
su - prometheus
wget https://github.com/prometheus/node_exporter/releases/download/v0.16.0-rc.1/node_exporter-0.16.0-rc.1.linux-amd64.tar.gz
Extract the node_exporter and rename the directory to 'node_exporter'.
tar -xzvf node_exporter-0.16.0-rc.1.linux-amd64.tar.gz
mv node_exporter-0.16.0-rc.1.linux-amd64 node_exporter
Next, we will create new service file for the node_exporter. Back to the root shell, goto the '/etc/systemd/system' directory and create new node_exporter service file 'node_exporter.service' using vim.
cd /etc/systemd/system/
vim node_exporter.service
There, paste node_exporter service configuration below.
[Unit]
Description=Node Exporter
Wants=network-online.target
After=network-online.target

[Service]
User=prometheus
ExecStart=/home/prometheus/node_exporter/node_exporter

[Install]
WantedBy=default.target
Save and exit.
Now reload the systemd system.
systemctl daemon-reload
Then start the node_exporter service and enable it to launch everytime at system startup.
systemctl start node_exporter
systemctl enable node_exporter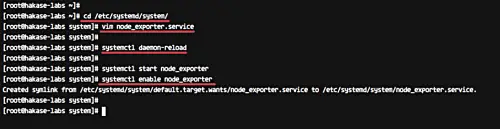
The node_exporter service is now running on the server - check it using the netstat command.
netstat -plntu
And you will get the node-exporter is running on port 9100.
Step 5 - Add node_exporter to the Prometheus Server
In this step, we will add the node_exporter to the prometheus server. Login to the prometheus user and edit the configuration 'prometheus.yml' file.
Login to the prometheus user.
su - prometheus
Goto the 'prometheus' directory and edit the configuration file 'prometheus.yml'.
cd prometheus/
vim prometheus.yml
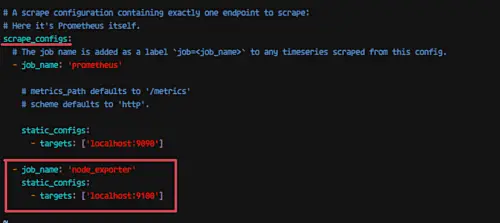
Under the 'scrape_config' line, add new job_name node_exporter by copy-pasting the configuration below.
  - job_name: 'node_exporter'
    static_configs:
      - targets: ['localhost:9100']
Save and exit.
Now restart the prometheus service.
systemctl restart prometheus
The node_exporter has been added to the prometheus server.
Step 6 - Testing Prometheus and node_exporter
Open your web browser and then input the server IP address.
http://192.168.33.10:9090/
Type the meminfo collector 'node_memory_MemAvailable_bytes' in the query field and click the 'Execute' button.
And you will get the result as below.
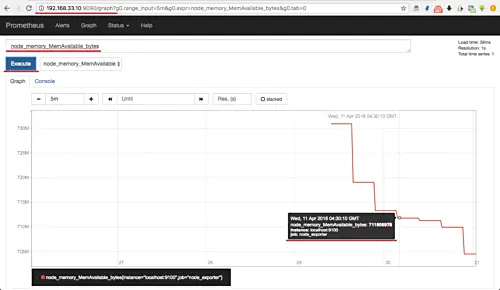
You will get the available memory on the server instance 'localhost:9100', and the job_name 'node-exporter'.
Or if you want to access the node_exporter raw data, you need to add the node_exporter port 9100 to the firewalld.
firewall-cmd --add-port=9100/tcp
firewall-cmd --reload
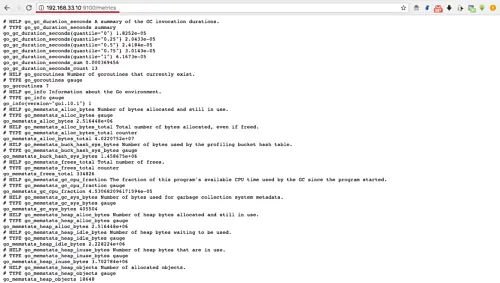
And then type the server IP address with port 9100.
http://192.168.33.10:9100/metrics
And you will get the node_exporter raw data as shown below.
Installation and configuration of the prometheus monitoring system with the node_exporter on CentOS 7 has been completed successfully.
Comments
Post a Comment
https://gengwg.blogspot.com/