Before we start nerding out and making changes, it’s important to understand how to get a look at our current state.
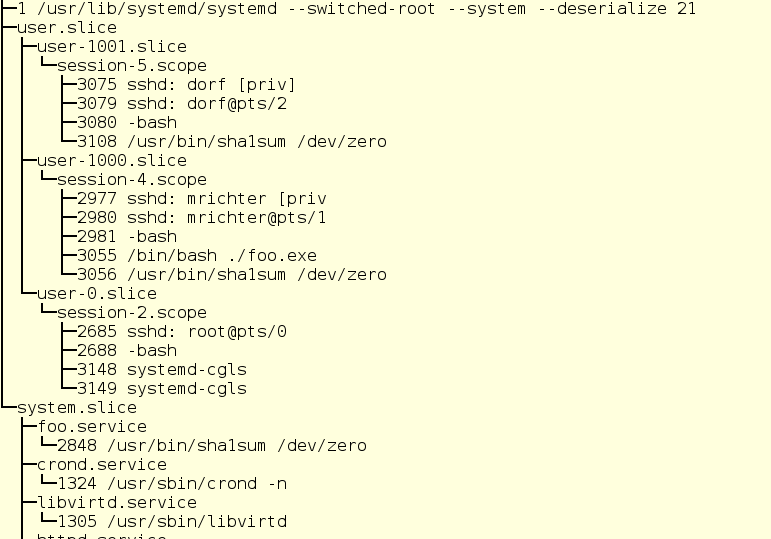
There are two tools that we can use to get a view of our current active cgroups on a system. The first tool is systemd-cgls. This command provides a tree-style listing of the cgroups and processes that are running within them on the system. Here’s an example of some output from the command:
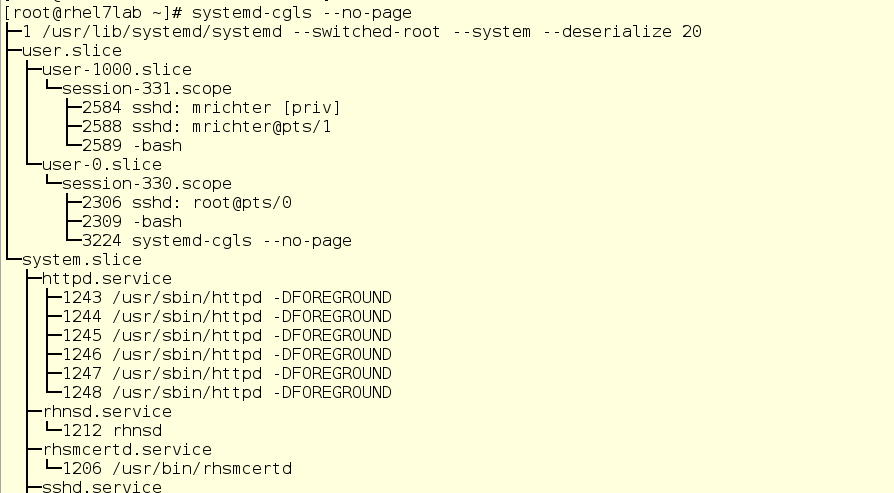
We can see two of the top level cgroups in this output - user.slice and system.slice. There are no hosted VMs on the system, so the two top level groups will share 50% of resources when under load (since the machine slice is not active). Under the user.slice, we have two child slices - user-1000.slice and user-0.slice. With user slices, they are identified by the User ID (UID) of the user in question, so it can be tricky to determine who actually owns that slice if the processes running aren’t identified in some way. In our example, we can draw the conclusion that user 1000 is mrichter and user 0 is root thanks to the ssh sessions that are running.
The other command we can use is systemd-cgtop. This shows a live display of current resource usage, much like the beloved top command we all know. Here is an example of what the output of that command looks like (and it updates in real time, just like top):
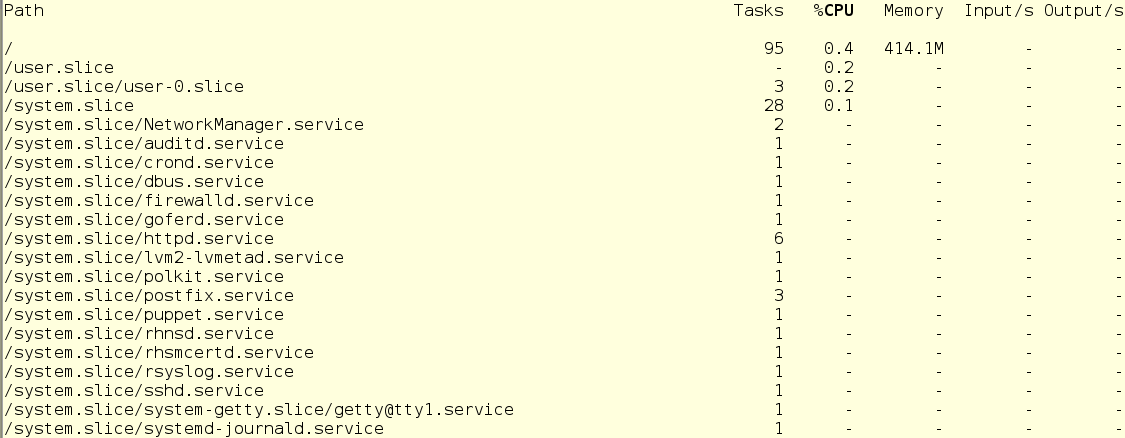
The challenge with systemd-cgtop is that we will only see stats for services or slices that have accounting enabled. This is done by creating a drop-in config file into the appropriate /etc/systemd/system subdirectory. For instance, here is the drop-in that would turn on CPU and memory accounting for the sshd service. To do this on your system, use your favorite text editor to create the drop-in. Of course, you could also use the systemctl set-property sshd.service CPUAccounting=true MemoryAccounting=true command to do the same thing. Your OS, your call.
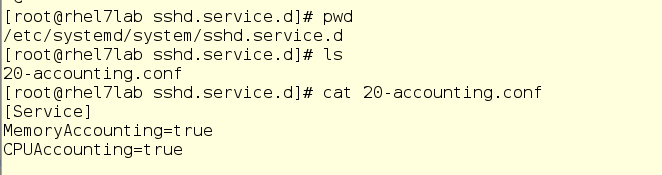
When you create a drop-in, it is necessary to issue the systemctl daemon-reload command as well as systemctl restart <service> for the proper service. Once these settings are in place, you will be able to see the usage stats but this has the possible unwanted side effect of increasing load on the system, as accounting isn’t free. So enable it sparingly for services and cgroups that you must monitor in this manner. I’ve found that just running top or iotop gives enough visibility that systemd-cgtop is often not needed. But it’s Linux, so do what makes you happy!
Balancing CPU Shares for Fun and Profit
Let’s take a look at how changing the CPU Shares assigned to a cgroup will impact performance on a system. For our test, we’re going to be looking at 2 non-privileged users and a system level service. We have our self-professed nerd, who uses the login mrichter. His UID is 1000, which we can check in the /etc/passwd file on our system.

This is important, as user slices are named based on the UID and not the actual account name.
Let’s take a quick peek at the drop-ins directory and see if his slice has anything yet.
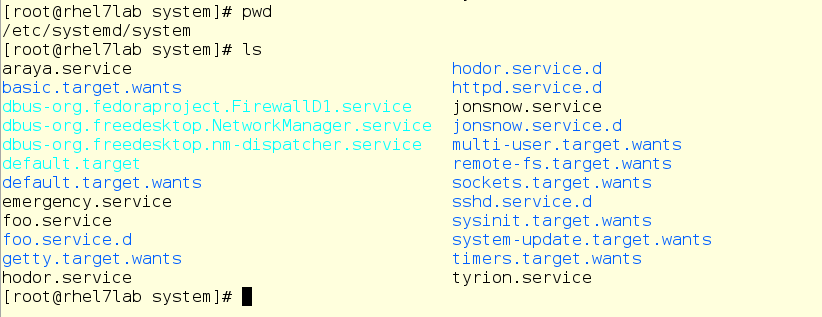
Nope. Although there are some items of interest in there already. We’re going to take a look at the things related to foo.sevice
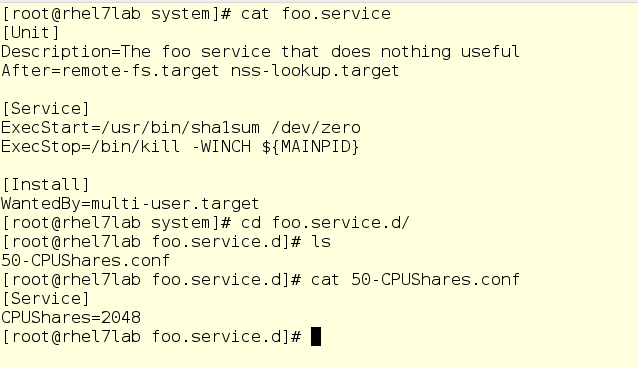
If you’re familiar with systemd unit files, you’ll recognize this as a fairly conventional unit file that runs the command /usr/bin/sha1sum /dev/zero as a service (also know as a daemon). What’s important to us is that foo will take literally all of the CPU that the system will allow it to use. We also have a drop-in configured for foo which grants it 2048 shares of CPU. The default is 1024, so foo will be granted twice the amount of CPU shares *within* it’s top level slice once the system is under load. Since foo is a service, it will be placed in the System slice.
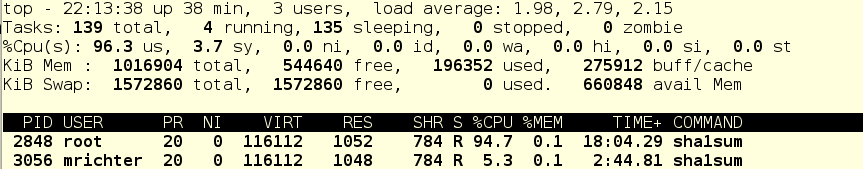
Let’s start foo up with a systemctl start foo.service and see what top shows us.
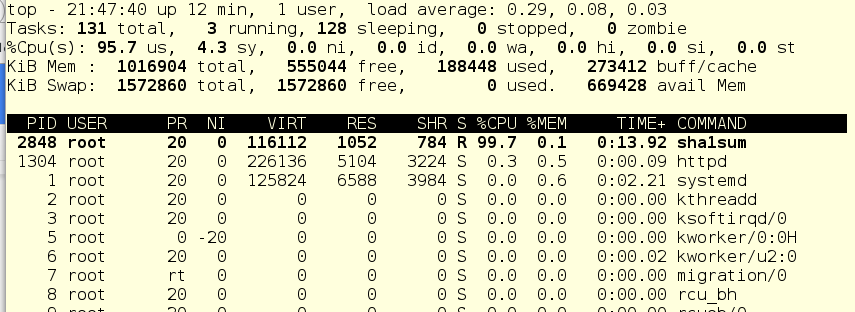
Since virtually nothing else is running, the foo service (pid 2848) is happily consuming most of our single CPU.
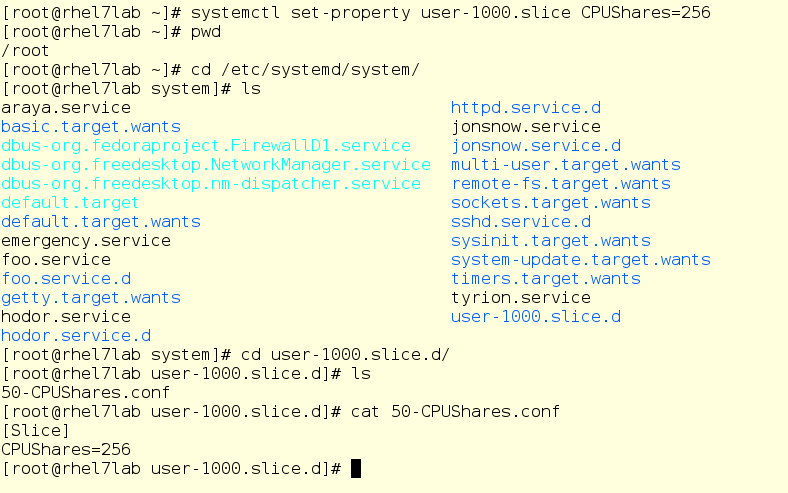
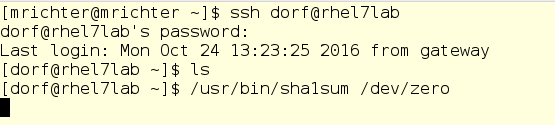
Let’s get mrichter into the mix. We’re going to set his CPU shares to a meager 256. He’s then going to login and start up foo.exe, which is the same program but in end user form.
Our intrepid user mrichter starts up foo. What does top show us?
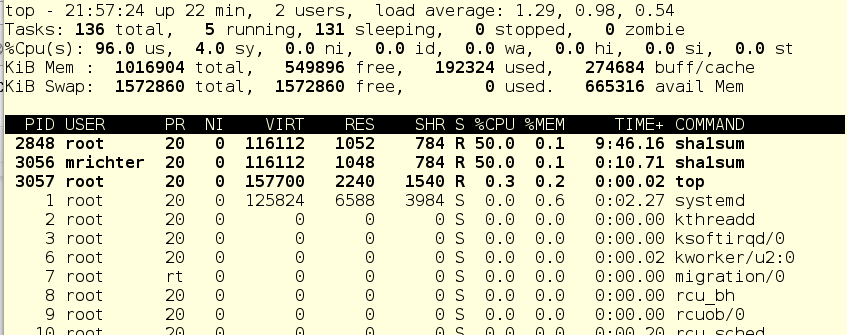
What the what? Shouldn’t mrichter be using about 10% of the CPU since foo.service has 2048 shares and mrichter has only 256? Let’s try adding our friend dorf into the mix. He’s another regular user but has the default 1024 shares. He’s gonna start foo up and we’ll see what the system is doing at that point.
Our friend dorf is old-school….he just starts the process up without using a clever wrapper script or the like.
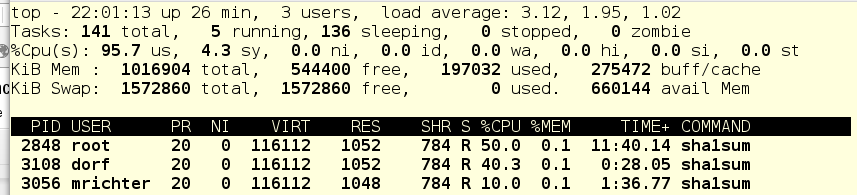
Hmmmm...let’s take a look at the cgroup tree and then I’ll explain what’s going on.
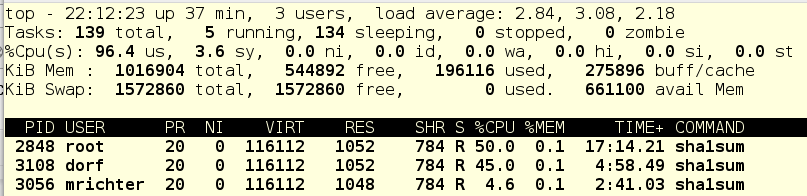
Remember, usually we have three top level cgroups - System, User, and Machine. Since we have no hosted VMs on this machine, only System and User are active. They each have 1024 CPU Shares, so under load, each of those top level slices will get half of the CPU time. So foo.service, which lives in System and has nothing else in this slice needing any significant time, will get about 50% CPU.
Inside of User, dorf has 1024 shares and mrichter has 256. Therefore, dorf will get approximately 4 times the processor time as mrichter. And looking at top, we see just that - foo.service is at 50%, dorf is getting 40% and mrichter is stuck at 10%.
In terms of a use case, we could say that dorf is more important and when he needs resources, the cgroup settings force mrichter to a lower usage, until such a time as dorf is done. That’s why we saw mrichter using 50% of the the CPU at first...no other processes inside of User were contesting him.
CPUShares essentially provides a “guaranteed minimum” amount of processor time, even for users or services that are lower priority. But we can also set a hard quota of CPU, effectively limiting the absolute amount of CPU time. Let’s do that with mrichter and see what happens.

Now let’s kill dorf’s job and see what might happen.
Beca use mrichter is capped to 5% of CPU, foo.service happily gobbles up the rest. Let’s add insult to injury and stop foo.service.
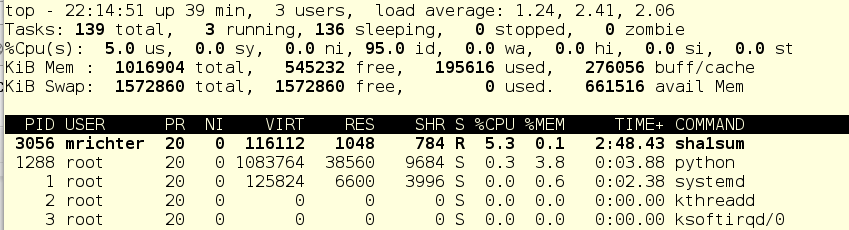
Look at that. Because mrichter is capped to 5%, the system now sits 95% idle. That seems almost mean.
You could use a setting like this on a service or application that is known to spike and gobble CPU, to prevent it from interfering with other services on the system.
We now know how to investigate the current active cgroups. Let’s go a little bit deeper and look at the virtual file system that has all of the cgroup goodness in it.
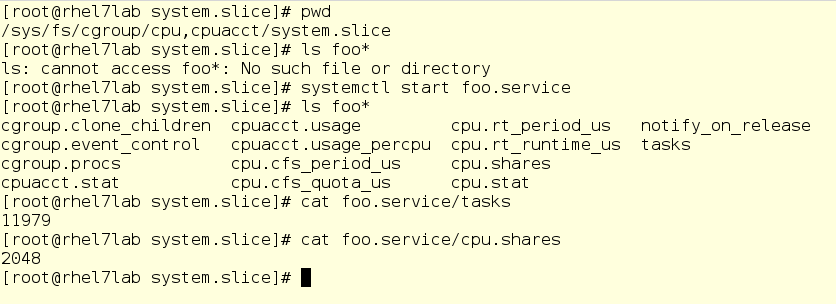
The top level directory for the live running cgroups is /sys/fs/cgroup. On system boot, this is populated by services and other tasks as they come online. As services are started up and shut down, their directories appear and disappear.
In the terminal below, we’ve changed in the subdirectory for the cpu controller, specifically into the system’s slice. We can see that foo’s subdirectory doesn’t exist. We then start foo up and can examine a few things - we look at the PID it’s running under as well as the current assigned CPUShares
Important safety tip/nerd note: We can echo new values into these to change settings on the fly. While this sounds awesome in theory (and it sure could be) it also has the potential for hilarity. Please exercise good judgment before you try this and never test such procedures on your production systems. In any case, this virtual file system is a good place to poke around as you go deeper with learning just how cgroups behave.
Next time we’ll take a look at capping memory use with cgroups. While much of what we’ve talked about in this entry will apply, there are some possible “gotchas!”
https://www.redhat.com/en/blog/world-domination-cgroups-part-2-turning-knobs
Comments
Post a Comment
https://gengwg.blogspot.com/